PeopleTools 8.58 has introduced the Kibana Visualizer within the PeopleSoft user interface. This is a feature that many of us were looking forward to using since we saw some demos at Oracle OpenWorld last year.
I recently installed HCM PUM Image 34 on my PC as a VirtualBox instance. While I knew it was on PeopleTools 8.58.03, I was pleasantly surprised that the instance was packaged (DPK) with Elasticsearch 7.0 and Kibana 7.0.
Per PeopleBooks referenced below, we need to ensure a few things before getting started with Kibana Dashboards in PeopleSoft.
PeopleBooks: Understanding Application Data and Kibana Dashboards

We already know from the VirtualBox manifest that we are on PeopleTools 8.58.03, Elasticsearch 7.0 and Kibana 7.0.
But before we get started, how do we ensure that both Elasticsearch and Kibana are running? I was getting inconsistent results on my VBox image where they would appear to be running after the initial install but will not start up after a restart.
A big thank you to my friend Andrew Casey who helped me with the commands to start Elastic and Kibana.
Start up Elasticsearch
Let us assume that elasticsearch is installed but not running. We need to first make sure that we can execute


Next we need to start up elasticsearch using

Refer: E-ES: How to Start and Stop the Elasticsearch Service on Windows and Linux Operating Systems (Doc ID 2404285.1)
Verify Elasticsearch is running
We can easily verify if Elasticsearch is functional using several methods. We can navigate to PeopleTools > Search Framework > Administration > Search Instance. Then we can Ping the search instance

Start Up Kibana
Now that Elasticsearch is running, we can turn our attention to Kibana. If Kibana has not been started, we will see the following error when we navigation to any delivered Kibana visualization/dashboard. For example, Recruiting (Homepage) > Application Details (Tile).

We can start Kibana by logging into putty as

Verify Kibana is running
Once we start Kibana, we can verify that Kibana is functional by logging into Kibana directly (using port 5601 in the case of VirtualBox) or by accessing a delivered visualization/dashboard.

Now we know that Kibana is working fine even though we see the following message.


This message only means that we don't have any index patterns created. We will address this in the following sections.
Getting started with Application Data and Kibana Dashboards
Now that we know how to consistently ensure that both Elasticseearch and Kibana are functional on our demo PUM image, we can start playing with some of the delivered (HCM PI 34) Kibana dashboards and visualizations.
From the PeopleBooks reference shared earlier, here is the process to get started with Kibana dashboards and visualizations.

In the case of delivered Kibana dashboards and visualizations, steps 1 and 2 are already completed by Oracle. The following delivered dashboards were available under PeopleTools > Search Framework > Administration > Import Kibana Dashboards.

Let us focus on the 'Application Details' dashboard in this blog post. We can see this dashboard has been configured as a Tile under PeopleTools > Search Framework > Administration > Kibana Visualizations.

We can also see how this Tile content reference is configured under PeopleTools > Portal > Structure and Content - Fluid Structure and Content > Fluid Pages > Analytics > Application Details. This covers step 3 from PeopleBooks.


The visualization security is configured under PeopleTools > Search Framework > Administration > Kibana Privileges. This covers step 4.

Step 5 requires us to deploy the dashboard that was configured in PeopleTools to Kibana. We can do this from PeopleTools > Search Framework > Administration > Deploy Kibana Dashboards. We can see from the image below that the status is 'Undeployed'. Let us go ahead and deploy the dashboard.


Since PS user already has access to all the roles assigned to this dashboard, we can now go ahead and test the dashboard.
Testing
While we continue to receive the same message as before, we will now notice that there are index patterns created for us by the deployment process.


Let us complete the configuration by selecting the delivered

Wait! Does this mean all users need to do this setup? No. This is a one time configuration that must be completed in Kibana.
Demo

I recently installed HCM PUM Image 34 on my PC as a VirtualBox instance. While I knew it was on PeopleTools 8.58.03, I was pleasantly surprised that the instance was packaged (DPK) with Elasticsearch 7.0 and Kibana 7.0.
Per PeopleBooks referenced below, we need to ensure a few things before getting started with Kibana Dashboards in PeopleSoft.
PeopleBooks: Understanding Application Data and Kibana Dashboards

We already know from the VirtualBox manifest that we are on PeopleTools 8.58.03, Elasticsearch 7.0 and Kibana 7.0.
But before we get started, how do we ensure that both Elasticsearch and Kibana are running? I was getting inconsistent results on my VBox image where they would appear to be running after the initial install but will not start up after a restart.
A big thank you to my friend Andrew Casey who helped me with the commands to start Elastic and Kibana.
Start up Elasticsearch
Let us assume that elasticsearch is installed but not running. We need to first make sure that we can execute
java within the Elasticsearch directory from command line as esadm1 user.

Next we need to start up elasticsearch using
nohup ./elasticsearch & command.
Refer: E-ES: How to Start and Stop the Elasticsearch Service on Windows and Linux Operating Systems (Doc ID 2404285.1)
Verify Elasticsearch is running
We can easily verify if Elasticsearch is functional using several methods. We can navigate to PeopleTools > Search Framework > Administration > Search Instance. Then we can Ping the search instance
PTSF_DEFAULT. Alternatively, we can simply perform a global search and verify the results.
Start Up Kibana
Now that Elasticsearch is running, we can turn our attention to Kibana. If Kibana has not been started, we will see the following error when we navigation to any delivered Kibana visualization/dashboard. For example, Recruiting (Homepage) > Application Details (Tile).

We can start Kibana by logging into putty as
esadm1 and executing the nohup ./kibana & command.
Verify Kibana is running
Once we start Kibana, we can verify that Kibana is functional by logging into Kibana directly (using port 5601 in the case of VirtualBox) or by accessing a delivered visualization/dashboard.

Now we know that Kibana is working fine even though we see the following message.

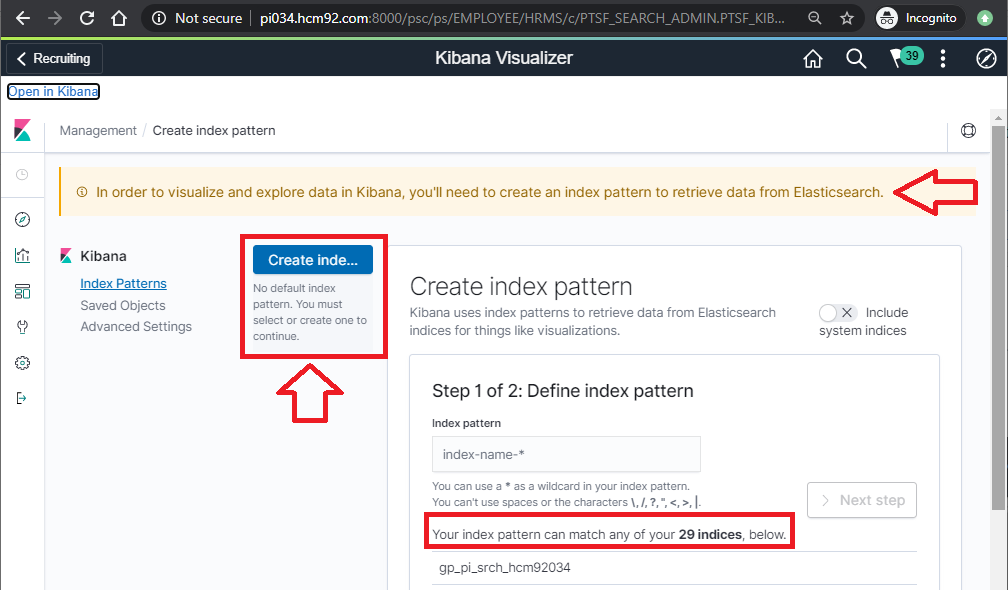
This message only means that we don't have any index patterns created. We will address this in the following sections.
Getting started with Application Data and Kibana Dashboards
Now that we know how to consistently ensure that both Elasticseearch and Kibana are functional on our demo PUM image, we can start playing with some of the delivered (HCM PI 34) Kibana dashboards and visualizations.
From the PeopleBooks reference shared earlier, here is the process to get started with Kibana dashboards and visualizations.

In the case of delivered Kibana dashboards and visualizations, steps 1 and 2 are already completed by Oracle. The following delivered dashboards were available under PeopleTools > Search Framework > Administration > Import Kibana Dashboards.

Let us focus on the 'Application Details' dashboard in this blog post. We can see this dashboard has been configured as a Tile under PeopleTools > Search Framework > Administration > Kibana Visualizations.

We can also see how this Tile content reference is configured under PeopleTools > Portal > Structure and Content - Fluid Structure and Content > Fluid Pages > Analytics > Application Details. This covers step 3 from PeopleBooks.


The visualization security is configured under PeopleTools > Search Framework > Administration > Kibana Privileges. This covers step 4.

Step 5 requires us to deploy the dashboard that was configured in PeopleTools to Kibana. We can do this from PeopleTools > Search Framework > Administration > Deploy Kibana Dashboards. We can see from the image below that the status is 'Undeployed'. Let us go ahead and deploy the dashboard.


Since PS user already has access to all the roles assigned to this dashboard, we can now go ahead and test the dashboard.
Testing
While we continue to receive the same message as before, we will now notice that there are index patterns created for us by the deployment process.


Let us complete the configuration by selecting the delivered
hc_hrs_app_index index pattern and setting it as the default as shown in the video below.
Wait! Does this mean all users need to do this setup? No. This is a one time configuration that must be completed in Kibana.
Demo

Awesome and perfect timing! We were testing out powerBI and other Viz tools but would rather keep it in PS. Thanks for sharing.
ReplyDeleteHi Sasank - Very informative posts!
ReplyDeleteI've just finished setting up FSCM PI 35 on a Windows host - it says that it includes Elastic Search and Kibana in the build. However, I wasn't able to get the Kibana test page up and running.
Guess I'd have to manually deploy Kibana from the command line - have a question regarding that though : when you run the following command - "nohup ./elasticsearch &" - it doesn't return to the command prompt automatically. Does it take a while to start the services?
Thanks again for your highly informative posts - much appreciated!
Hi Mani - Great question.
DeleteI should have included this in the blog but I am glad you asked about it. Yes - the nohup command did that to me as well. I usually open a separate putty session and run this command. You can exit out of the command by hitting the ENTER key. I exit once I can verify that elasticsearch is running.
Hope this helps.
Hi Sasank, I am getting internal server error on Kibana. Although I have given Search Administrator and Portal Administrator roles to my id. Also, getting (401 Status code) error on Application Details tiles. I am not sure where this is going wrong.
ReplyDeleteHi Payal - Just to be sure. Have you made sure Elasticsearch and Kibana is running?
DeleteAre you able to directly login to Kibana?
Also, is this install done as a virtualbox instance? I know that only VirtualBox PUM 34 image provides and executes the DPK necessary for Elasticsearch or Kibana.
DeleteIf this is a native install, you/your admin will need to set up Elasticsearch and Kibana.
Hello Sasank, yes our Kibana and Elastic search is up and running and we are able get into the kibana console, when login we are getting-
ReplyDeleteInternal Server Error
Less InfoOK
SearchError: Internal Server Error
at http://servername:5601/bundles/kibana.bundle.js:2:521709
at processQueue (http://servername:5601/built_assets/dlls/vendors.bundle.dll.js:293:199687)
at http://servername:5601/built_assets/dlls/vendors.bundle.dll.js:293:200650
at Scope.$digest (http://servername:5601/built_assets/dlls/vendors.bundle.dll.js:293:210412)
at Scope.$apply (http://servername:5601/built_assets/dlls/vendors.bundle.dll.js:293:213219)
at done (http://servername:5601/built_assets/dlls/vendors.bundle.dll.js:293:132717)
at completeRequest (http://servername:5601/built_assets/dlls/vendors.bundle.dll.js:293:136329)
at XMLHttpRequest.requestLoaded (http://servername:5601/built_assets/dlls/vendors.bundle.dll.js:293:135225)
@Mudit - I am not sure what is the problem on your end. Have you created a service request with Oracle Support? They might have additional guidance on this error.
DeleteIt seems you have not deployed the search definition for recruiting solutions. Once you deployed should resolved the error.
DeleteHi Sasank,
DeleteIs there any way to show the Kibana visualizations and dashboards in classis pages ? Right now in 8.58 i can see deployment for Kibana to PeopleSoft only 1. Tile 2. Component Level which will be published as related content.
Any hacks or idea for classic ? If so, a simple POC
Thanks,
Nayan
@Nayan Paul - Great question.
DeleteRefer: https://pe0ples0ft.blogspot.com/2020/07/858-kibana-4.html
Hi Sasank,
DeleteGreat, thanks. Just another questions - What software you used to make animated gif ?
Thanks,
Nayan
I use LICEcap which is free. There may be other options which work better but I have not explored.
DeleteI also played with ScreenToGif which also seems to work well!
DeleteHello Sasank, answer to your question to payal is yes elastic search and kibana is up and running fine, we are able to login to the kibana console, however after that we are getting -
ReplyDeleteInternal Server Error
Less InfoOK
SearchError: Internal Server Error
at http://servername:5601/bundles/kibana.bundle.js:2:521709
at processQueue (http://servername:5601/built_assets/dlls/vendors.bundle.dll.js:293:199687)
at http://servername:5601/built_assets/dlls/vendors.bundle.dll.js:293:200650
at Scope.$digest (http://servername:5601/built_assets/dlls/vendors.bundle.dll.js:293:210412)
at Scope.$apply (http://servername:5601/built_assets/dlls/vendors.bundle.dll.js:293:213219)
at done (http://servername:5601/built_assets/dlls/vendors.bundle.dll.js:293:132717)
at completeRequest (http://servername:5601/built_assets/dlls/vendors.bundle.dll.js:293:136329)
at XMLHttpRequest.requestLoaded (http://servername:5601/built_assets/dlls/vendors.bundle.dll.js:293:135225)
I performed below steps and Status Code 401 error on delivered Application Details tile is gone.
ReplyDelete1. Navigate to /opt/oracle/ES/pt/Kibana7.0.0/plugins/orcl-auth-kibana/server/routes/authroutes.js.
2. In the JavaScript file authroutes.js comment out // return Boom.unauthorized('unauthorized login not allowed!').
3. Re-bounce Kibana and retest.
I am not sure if that is a good idea to remove that line. You need to find out why you are unable to access via PeopleSoft.
DeleteAre you using a PUM image? If not, did you use the PeopleSoft delivered DPK for installing Kibana and Elasticsearch?
This was the solution offered by Oracle Support Team. I am not using PUM and we used PS delivered DPKs. Kibana and ES were running
DeleteHi Sasank,
ReplyDeleteHow can we migrate the Kibana Dashboards and Visualizations from DEV to TEST/PROD env? We are currently using migration tool to migrate PS objects.
Good question. We can use App Designer Projects for migrating the data source (PS Query or Connected Query). We can use Application Data Sets to migrate any Elasticsearch and Kibana configuration. You can refer the following document on My Oracle Support.
DeleteE-KB: How to Migrate Kibana Dashboards From One Environment to Another? (Doc ID 2684543.1)
Hi Sasank,
ReplyDeleteI have done everything you have suggested and Kibana and Elastic search is running in my FSCM 9.2 virtual box environement. My issue is that when I sign in as VP1 and try to deploy a dashboard, I do not see the deploy or update button on the bottom of the page. Just wondering if you ran into this too? Thank you.
Hi Noel,
DeleteSorry for the delay. I have not run into this one. It is strange that you are able to import the dashboards but not able to deploy them.
Have you tried tracing the page that is hiding the deploye/update button? That might give you some clues as to what might be missing. I suspect some level of security/config might be the issue.
Thanks,
Sasank
Hi Sasank,
ReplyDeleteDo you have details on how we can setup Kibana to start as a service, other than using nssm utility
Thanks
Prasath
I Prasath - I don't have any experience with that. You may want to join the psadmin.io Slack channel and post your question there. I am sure there are other admins in the community who might have some ideas.
DeleteLikewise, reach out to Oracle Support if you have not done so already.