PeopleTools 8.58 has introduced the Kibana Visualizer within the PeopleSoft user interface. This is a feature that many of us were looking forward to using since we saw some demos at Oracle OpenWorld last year.
I recently installed HCM PUM Image 34 on my PC as a VirtualBox instance. While I knew it was on PeopleTools 8.58.03, I was pleasantly surprised that the instance was packaged (DPK) with Elasticsearch 7.0 and Kibana 7.0.
Per PeopleBooks referenced below, we need to ensure a few things before getting started with Kibana Dashboards in PeopleSoft.
PeopleBooks: Understanding Application Data and Kibana Dashboards

We already know from the VirtualBox manifest that we are on PeopleTools 8.58.03, Elasticsearch 7.0 and Kibana 7.0.
But before we get started, how do we ensure that both Elasticsearch and Kibana are running? I was getting inconsistent results on my VBox image where they would appear to be running after the initial install but will not start up after a restart.
A big thank you to my friend Andrew Casey who helped me with the commands to start Elastic and Kibana.
Start up Elasticsearch
Let us assume that elasticsearch is installed but not running. We need to first make sure that we can execute


Next we need to start up elasticsearch using

Refer: E-ES: How to Start and Stop the Elasticsearch Service on Windows and Linux Operating Systems (Doc ID 2404285.1)
Verify Elasticsearch is running
We can easily verify if Elasticsearch is functional using several methods. We can navigate to PeopleTools > Search Framework > Administration > Search Instance. Then we can Ping the search instance

Start Up Kibana
Now that Elasticsearch is running, we can turn our attention to Kibana. If Kibana has not been started, we will see the following error when we navigation to any delivered Kibana visualization/dashboard. For example, Recruiting (Homepage) > Application Details (Tile).

We can start Kibana by logging into putty as

Verify Kibana is running
Once we start Kibana, we can verify that Kibana is functional by logging into Kibana directly (using port 5601 in the case of VirtualBox) or by accessing a delivered visualization/dashboard.

Now we know that Kibana is working fine even though we see the following message.


This message only means that we don't have any index patterns created. We will address this in the following sections.
Getting started with Application Data and Kibana Dashboards
Now that we know how to consistently ensure that both Elasticseearch and Kibana are functional on our demo PUM image, we can start playing with some of the delivered (HCM PI 34) Kibana dashboards and visualizations.
From the PeopleBooks reference shared earlier, here is the process to get started with Kibana dashboards and visualizations.

In the case of delivered Kibana dashboards and visualizations, steps 1 and 2 are already completed by Oracle. The following delivered dashboards were available under PeopleTools > Search Framework > Administration > Import Kibana Dashboards.

Let us focus on the 'Application Details' dashboard in this blog post. We can see this dashboard has been configured as a Tile under PeopleTools > Search Framework > Administration > Kibana Visualizations.

We can also see how this Tile content reference is configured under PeopleTools > Portal > Structure and Content - Fluid Structure and Content > Fluid Pages > Analytics > Application Details. This covers step 3 from PeopleBooks.


The visualization security is configured under PeopleTools > Search Framework > Administration > Kibana Privileges. This covers step 4.

Step 5 requires us to deploy the dashboard that was configured in PeopleTools to Kibana. We can do this from PeopleTools > Search Framework > Administration > Deploy Kibana Dashboards. We can see from the image below that the status is 'Undeployed'. Let us go ahead and deploy the dashboard.


Since PS user already has access to all the roles assigned to this dashboard, we can now go ahead and test the dashboard.
Testing
While we continue to receive the same message as before, we will now notice that there are index patterns created for us by the deployment process.


Let us complete the configuration by selecting the delivered

Wait! Does this mean all users need to do this setup? No. This is a one time configuration that must be completed in Kibana.
Demo

I recently installed HCM PUM Image 34 on my PC as a VirtualBox instance. While I knew it was on PeopleTools 8.58.03, I was pleasantly surprised that the instance was packaged (DPK) with Elasticsearch 7.0 and Kibana 7.0.
Per PeopleBooks referenced below, we need to ensure a few things before getting started with Kibana Dashboards in PeopleSoft.
PeopleBooks: Understanding Application Data and Kibana Dashboards

We already know from the VirtualBox manifest that we are on PeopleTools 8.58.03, Elasticsearch 7.0 and Kibana 7.0.
But before we get started, how do we ensure that both Elasticsearch and Kibana are running? I was getting inconsistent results on my VBox image where they would appear to be running after the initial install but will not start up after a restart.
A big thank you to my friend Andrew Casey who helped me with the commands to start Elastic and Kibana.
Start up Elasticsearch
Let us assume that elasticsearch is installed but not running. We need to first make sure that we can execute
java within the Elasticsearch directory from command line as esadm1 user.

Next we need to start up elasticsearch using
nohup ./elasticsearch & command.
Refer: E-ES: How to Start and Stop the Elasticsearch Service on Windows and Linux Operating Systems (Doc ID 2404285.1)
Verify Elasticsearch is running
We can easily verify if Elasticsearch is functional using several methods. We can navigate to PeopleTools > Search Framework > Administration > Search Instance. Then we can Ping the search instance
PTSF_DEFAULT. Alternatively, we can simply perform a global search and verify the results.
Start Up Kibana
Now that Elasticsearch is running, we can turn our attention to Kibana. If Kibana has not been started, we will see the following error when we navigation to any delivered Kibana visualization/dashboard. For example, Recruiting (Homepage) > Application Details (Tile).

We can start Kibana by logging into putty as
esadm1 and executing the nohup ./kibana & command.
Verify Kibana is running
Once we start Kibana, we can verify that Kibana is functional by logging into Kibana directly (using port 5601 in the case of VirtualBox) or by accessing a delivered visualization/dashboard.

Now we know that Kibana is working fine even though we see the following message.

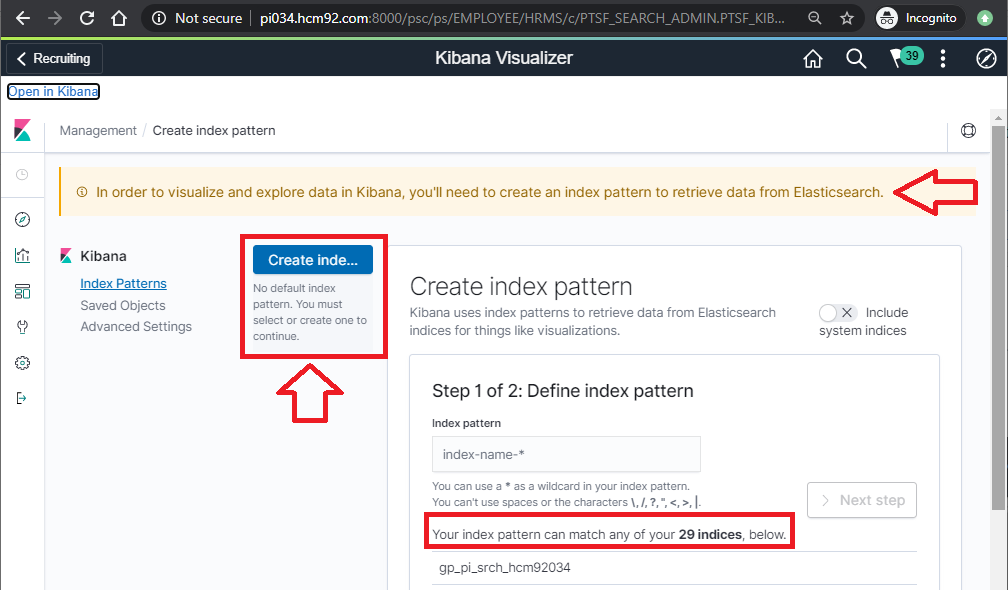
This message only means that we don't have any index patterns created. We will address this in the following sections.
Getting started with Application Data and Kibana Dashboards
Now that we know how to consistently ensure that both Elasticseearch and Kibana are functional on our demo PUM image, we can start playing with some of the delivered (HCM PI 34) Kibana dashboards and visualizations.
From the PeopleBooks reference shared earlier, here is the process to get started with Kibana dashboards and visualizations.

In the case of delivered Kibana dashboards and visualizations, steps 1 and 2 are already completed by Oracle. The following delivered dashboards were available under PeopleTools > Search Framework > Administration > Import Kibana Dashboards.

Let us focus on the 'Application Details' dashboard in this blog post. We can see this dashboard has been configured as a Tile under PeopleTools > Search Framework > Administration > Kibana Visualizations.

We can also see how this Tile content reference is configured under PeopleTools > Portal > Structure and Content - Fluid Structure and Content > Fluid Pages > Analytics > Application Details. This covers step 3 from PeopleBooks.


The visualization security is configured under PeopleTools > Search Framework > Administration > Kibana Privileges. This covers step 4.

Step 5 requires us to deploy the dashboard that was configured in PeopleTools to Kibana. We can do this from PeopleTools > Search Framework > Administration > Deploy Kibana Dashboards. We can see from the image below that the status is 'Undeployed'. Let us go ahead and deploy the dashboard.


Since PS user already has access to all the roles assigned to this dashboard, we can now go ahead and test the dashboard.
Testing
While we continue to receive the same message as before, we will now notice that there are index patterns created for us by the deployment process.


Let us complete the configuration by selecting the delivered
hc_hrs_app_index index pattern and setting it as the default as shown in the video below.
Wait! Does this mean all users need to do this setup? No. This is a one time configuration that must be completed in Kibana.
Demo
